Fibonacci Optimal Entry Zone [OTE] (Zeiierman)█ Overview
Fibonacci Optimal Entry Zone (Zeiierman) is a high-precision market structure tool designed to help traders identify ideal entry zones during trending markets. Built on the principles of Smart Money Concepts (SMC) and Fibonacci retracements, this indicator highlights key areas where price is most likely to react — specifically within the "Golden Zone" (between the 50% and 61.8% retracement).
It tracks structural pivot shifts (CHoCH) and dynamically adjusts Fibonacci levels based on real-time swing tracking. Whether you're trading breakouts, pullbacks, or optimal entries, this tool brings unparalleled clarity to structure-based strategies.
Ideal for traders who rely on confluence, this indicator visually synchronizes swing highs/lows, market structure shifts, Fibonacci retracement levels, and trend alignment — all without clutter or lag.
⚪ The Structural Assumption
Price moves in waves, but key retracements often lead to continuation or reversal — especially when aligned with structure breaks and trend shifts.
The Optimal Entry Zone captures this behavior by anchoring Fibonacci levels between recent swing extremes. The most powerful area — the Golden Zone — marks where institutional re-entry is likely, providing traders with a sniper-like roadmap to structure-based entries.
█ How It Works
⚪ Structure Tracking Engine
At its core, the indicator detects pivots and classifies trend direction:
Structure Period – Determines the depth of pivots used to detect swing highs/lows.
CHoCH – Break of structure logic identifies where the trend shifts or continues, marked visually on the chart.
Bullish & Bearish Modes – Independently toggle uptrend and downtrend detection and styling.
⚪ Fibonacci Engine
Upon each confirmed structural shift, Fibonacci retracement levels are projected between swing extremes:
Custom Levels – Choose which retracements (0.50, 0.618, etc.) are shown.
Real-Time Adjustments – When "Swing Tracker" is enabled, levels and labels update dynamically as price forms new swings.
Example:
If you disable the Swing Tracker, the Golden Level is calculated using the most recent confirmed swing high and low.
If you enable the Swing Tracker, the Golden Level is calculated from the latest swing high or low, making it more adaptive as the trend evolves in real time.
█ How to Use
⚪ Structure-Based Entry
Wait for CHoCH events and use the resulting Fibonacci projection to identify entry points. Enter trades as price taps into the Golden Zone, especially when confluence forms with swing structure or order blocks.
⚪ Real-Time Reaction Tracking
Enable Swing Tracker to keep the tool live — constantly updating zones as price shifts. This is especially useful for scalpers or intraday traders who rely on fresh swing zones.
█ Settings
Structure Period – Number of bars used to define swing pivots. Larger values = stronger structure.
Swing Tracker – Auto-updates fib levels as new highs/lows form.
Show Previous Levels – Keep older fib zones on chart or reset with each structure shift.
-----------------
Disclaimer
The content provided in my scripts, indicators, ideas, algorithms, and systems is for educational and informational purposes only. It does not constitute financial advice, investment recommendations, or a solicitation to buy or sell any financial instruments. I will not accept liability for any loss or damage, including without limitation any loss of profit, which may arise directly or indirectly from the use of or reliance on such information.
All investments involve risk, and the past performance of a security, industry, sector, market, financial product, trading strategy, backtest, or individual's trading does not guarantee future results or returns. Investors are fully responsible for any investment decisions they make. Such decisions should be based solely on an evaluation of their financial circumstances, investment objectives, risk tolerance, and liquidity needs.
Поиск скриптов по запросу "smart money"

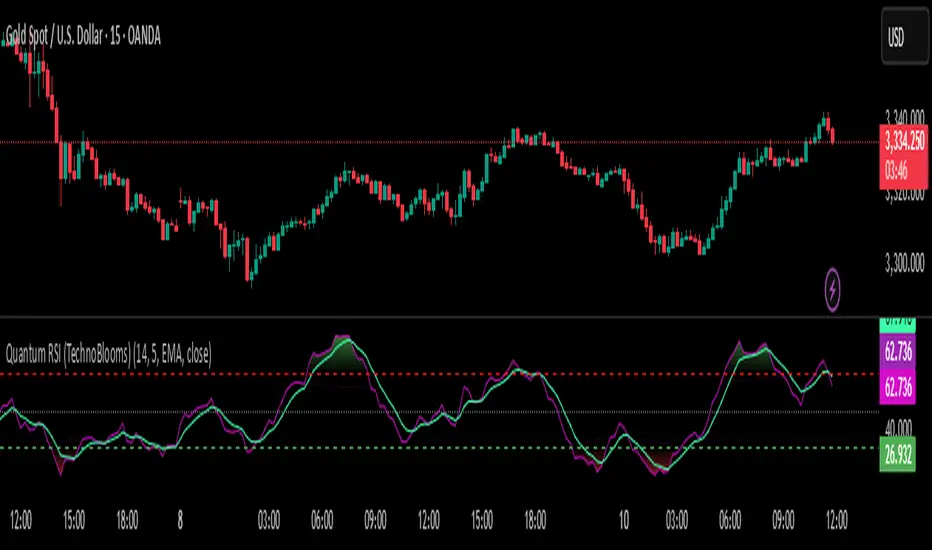
Quantum RSI (TechnoBlooms)The Next Evolution of Momentum Analysis
📘 Overview
Quantum RSI is an advanced momentum oscillator based on Quantum Price Theory, designed as a superior alternative to the traditional RSI. It incorporates a Gaussian decay function to weigh price changes, creating a more responsive and intuitive measure of trend strength.
This indicator excels in identifying micro-trends and subtle momentum shifts — especially in narrow or low-volatility environments where standard RSI typically lags or gives false signals. With its enhanced smoothing, intuitive color gradients, and customizable moving average, Quantum RSI offers a powerful tool for traders seeking clarity and precision.
🔍 Key Features
• ⚛️ Quantum Momentum Engine: Measures net momentum using quantum-inspired Gaussian decay weighting.
• 🎨 Color-Reversed Gradient Zones:
o Green (Overbought): Shows momentum strength, not weakness.
o Red (Oversold): Highlights momentum exhaustion and potential bounce.
• 🧠 Smoothing with MA: Option to apply moving average (SMA/EMA/WMA/SMMA/VWMA) to the Quantum RSI line.
• 📊 Levels at 30 / 50 / 70: Standard RSI levels for decision-making guidance.
• 📈 Intuitive Visuals: Gradient fills for cleaner interpretation of zones and transitions.
👤 Who Is It For?
• Technical traders seeking a modern alternative to RSI.
• Quantitative analysts who value precision and smooth signal flow.
• Visual traders looking for intuitive, color-coded trend zones.
• Traders focused on market microstructure and early trend detection.
💡 Pro Tips
• Pair with order blocks, market structure tools, or Fibonacci confluences for high-probability entries.
• Use on assets with frequent compression or consolidation, where traditional RSI often misleads.
• Combine with volume-based indicators or smart money concepts for added confirmation.
• Ideal for sideways markets, false breakouts, or low-volatility zones where typical RSI lags.
AP Session Liquidity with EQH/EQL and Previous DayThis indicator plots key intraday session highs and lows, along with essential market structure levels, to help traders identify areas of interest, potential liquidity zones, and high-probability trade setups. It includes the Asia Session High and Low (typically 00:00–08:00 UTC), London Session High and Low (08:00–12:00 UTC), New York AM Session High and Low (12:00–15:00 UTC), and New York Lunch High and Low (15:00–17:00 UTC). Additionally, it displays the Previous Day’s High and Low for context on recent price action, as well as automatically detected Equal Highs and Lows based on configurable proximity settings to highlight potential liquidity pools or engineered price levels. These session levels are widely used by institutional traders and are critical for analyzing market behavior during time-based volatility windows. Traders can use this indicator to anticipate breakouts, fakeouts, and reversals around session boundaries—such as liquidity grabs at Asia highs/lows before the London or New York sessions—or to identify key consolidation and expansion zones. Equal Highs and Lows serve as magnets for price, offering insight into potential stop hunts or inducement zones. This tool is ideal for day traders, scalpers, and smart money concept practitioners, and includes full customization for session timings, color schemes, line styles, and alert conditions. Whether you're trading price action, ICT concepts, or supply and demand, this indicator provides a powerful framework for intraday analysis.

Math by Thomas Liquidity PoolDescription
Math by Thomas Liquidity Pool is a TradingView indicator designed to visually identify potential liquidity pools on the chart by detecting areas where price forms clusters of equal highs or equal lows.
Bullish Liquidity Pools (Green Boxes): Marked below price where two adjacent candles have similar lows within a specified difference, indicating potential demand zones or stop loss clusters below support.
Bearish Liquidity Pools (Red Boxes): Marked above price where two adjacent candles have similar highs within the difference threshold, indicating potential supply zones or stop loss clusters above resistance.
This tool helps traders spot areas where smart money might hunt stop losses or where price is likely to react, providing valuable insight for trade entries, exits, and risk management.
Features:
Adjustable box height (vertical range) in points.
Adjustable maximum difference threshold between candle highs/lows to consider them equal.
Boxes automatically extend forward for visibility and delete when price sweeps through or after a defined lifetime.
Separate visual zones for bullish and bearish liquidity with customizable colors.
How to Use
Add the Indicator to your chart (preferably on instruments like Nifty where point-based thresholds are meaningful).
Adjust Inputs:
Box Height: Set the vertical size of the liquidity zones (default 15 points).
Max Difference Between Highs/Lows: Set the max price difference to consider two candle highs or lows as “equal” (default 10 points).
Box Lifetime: How many bars the box stays visible if not swept (default 120 bars).
Interpret Boxes:
Green Boxes (Bullish Liquidity Pools): Areas of potential demand and stop loss clusters below price. Watch for price bounces or accumulation near these zones.
Red Boxes (Bearish Liquidity Pools): Areas of potential supply and stop loss clusters above price. Watch for price rejections or distribution near these zones.
Trading Strategy Tips:
Use these zones to anticipate where stop loss hunting or liquidity sweeps may occur.
Combine with your Order Block, Fair Value Gap, and Market Structure tools for higher probability setups.
Manage risk by avoiding entries into price regions just before large liquidity pools get swept.
Automatic Cleanup:
Boxes delete automatically once price breaks above (for bearish zones) or below (for bullish zones) the zone or after the set lifetime.

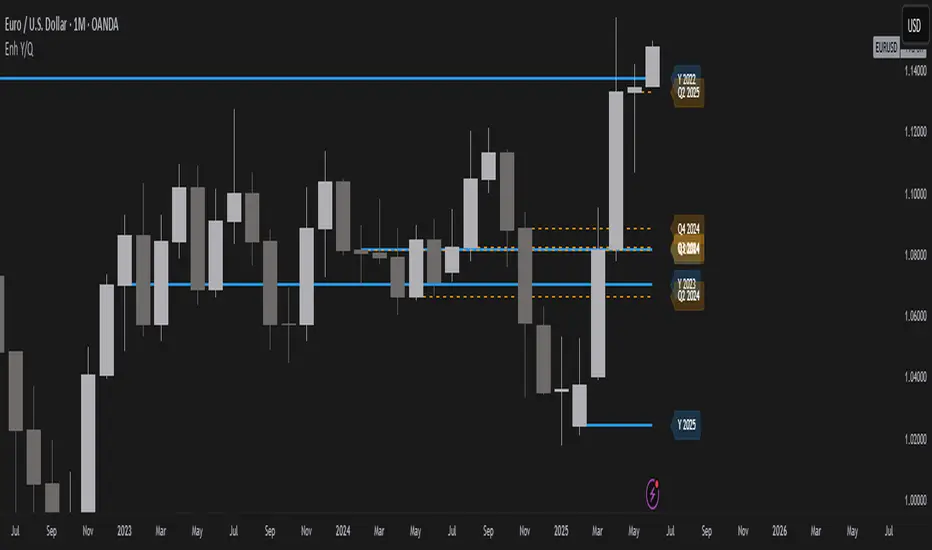
Year/Quarter Open LevelsDeveloped by ADEL CEZAR and inspired by insights from ERDAL Y, this indicator is designed to give traders a clear edge by automatically plotting the Yearly Open and Quarterly Open levels — two of the most critical institutional reference points in price action.
These levels often act as magnets for liquidity, bias confirmation zones, and support/resistance pivots on higher timeframes. With customizable settings, you can display multiple past opens, fine-tune label positions, and align your strategy with high-timeframe structure — all in a lightweight, non-intrusive design.
If you follow Smart Money Concepts (SMC), ICT models, or build confluence using HTF structures and range theory, this script will integrate seamlessly into your workflow.
Higher Timeframe Market StructureHTF Market Structure – ZigZag, Break of Structure & Supply/Demand
This powerful indicator is designed to identify higher-timeframe market structure using a combination of ZigZag patterns, Break of Structure (BOS) signals, and Supply/Demand zones.
Key Features:
Automatic detection of Higher Highs (HH), Higher Lows (HL), Lower Lows (LL), and Lower Highs (LH)
Internal structure shifts based on Open or High/Low logic
Supply and Demand zones plotted on the chart
Break of Structure (BOS) lines with optional alerts
Mitigation logic to mark or delete invalidated order blocks
Customizable aggregation factor to view higher time frame structure on lower time frames
How to Use:
Focus on market structure and BOS to understand the current trend.
Watch for internal shifts as early signals of potential reversals.
Use ZigZag lines to connect swing highs and lows to visualize market rhythm.
Supply zones (red) and Demand zones (green) are automatically drawn after structure breaks:
Use Demand Zones in Bullish Markets for the highest probability entries.
Use Supply Zones in Bearish Markets to align with the prevailing trend.
Best Practices:
Only use Demand Zones in Bullish markets and Supply Zones in Bearish markets for optimal results.
Look for price action or reversal signals within these zones to refine your entries.
Enable alerts to get notified on:
New order blocks
Internal shifts
BOS events
HH, HL, LL, LH formations
Liquidity sweeps
Customization Options:
Aggregation Factor: Control how many candles are grouped for structure analysis.
Zone Duration: Define how length of plotted zones.
Mitigation Settings: Automatically delete or fade zones after mitigation.
Colors: Choose custom colors for bullish and bearish zones and structure markers.
This tool is ideal for traders who rely on price action, structure, and smart money concepts. Combine it with your own S&D strategy or integrate it with other confluence tools for even better precision.

Supply/Demand Zones + Engulfment-based ExecutionSupply/Demand Zones + Engulfment-Based Execution
Strategy Overview
This strategy combines institutional trading concepts—supply/demand zones and engulfing candle patterns—to generate high-probability long and short trade setups. The system uses aggregated price action to identify potential reversal zones and confirms entries with engulfing candle patterns, ensuring trades are only taken when market structure shows commitment in the direction of the trade.
Core Concepts
• Supply & Demand Zones: These are automatically detected by analyzing aggregated bullish and bearish candle structures over user-defined intervals. Supply zones are formed after bearish continuation patterns; demand zones appear after bullish continuation patterns.
• Engulfing Entries: Once price enters a zone, the strategy waits for a bullish engulfing pattern (in a demand zone) or a bearish engulfing pattern (in a supply zone) before executing a trade. This adds confirmation and reduces false signals.
• Risk Management: Stop-loss is placed at the low (for long trades) or high (for short trades) of the engulfed candle. Take-profit can be calculated using a fixed R-multiple (risk-to-reward ratio) or a user-defined target price.
Key Features
Fully customizable aggregation factor for zone detection
Visual zone boxes, entry/SL/TP boxes, and engulfing pattern labels
Optional removal of mitigated zones for cleaner charting
Configurable trade mode (Long only, Short only, or Both)
Support for trading sessions and date filtering
Alerts for price entering supply or demand zones
How to Use
Select Aggregation Factor: Choose how many candles to group together for identifying key zones (e.g., 4x timeframe).
Enable Zones: Turn on supply and/or demand zones as needed.
Set Execution Parameters:
– Choose R-multiple (e.g., 2:1 risk-reward)
– Or use a fixed take-profit price
Define Trade Time Window:
– Set the date and time ranges to restrict execution
– Use Start Hour and End Hour to limit trades to specific sessions (e.g., London/New York)
Run on Desired Timeframe: Typically used on 15m–4H charts, depending on your strategy and the asset’s volatility.
Ideal For
• Traders using Smart Money Concepts (SMC)
• Those who value high-confluence entries
• Intraday to swing traders looking for structure-based automation
⚠️ Important Notes
• The strategy requires engulfing confirmation within the zone to enter a position.
• This script does not repaint and executes trades on a bar close basis.
• Backtest results may vary based on session filters and aggregation factor.
© Attribution
This strategy was developed by The_Forex_Steward and is licensed under the Mozilla Public License 2.0.
You are free to use, modify, and distribute it under the terms of that license.

Time LevelsTime Levels is a customizable TradingView indicator designed to mark critical intraday price levels based on specific time inputs. This tool helps traders identify significant Open/High/Low/Close (OHLC) levels, support & resistance (S&R) zones, and potential Judas Swing manipulation points—aligned with selected timeframes and adjusted to any time zone via UTC offset.
🔧 Key Features:
OHLC/OLHC Levels: Automatically draws horizontal lines at the candle’s open price for up to four specified time points. Ideal for marking session opens, closes, or key intraday levels.
Support & Resistance Zones: Highlights two time-based S&R levels that can help identify discount and premium pricing zones.
Judas Swing Detection: Marks potential liquidity grab zones (Judas Swings) at three user-defined times, assisting in identifying manipulation and smart money entry points.
Global Timezone Support: Includes a UTC offset input to align levels accurately with your trading session, regardless of your location.
Full Customization: Personalize the color, style (solid, dashed, dotted), and thickness of each line independently for OHLC, S&R, and Judas levels.
🛠️ Use Cases:
New York / London open price tracking
ICT-based SMC level marking
Predefined time-based liquidity level visualizations
Institutional-level price reactions (e.g., during specific market opens)
This indicator is best suited for intraday and short-term (especially ICT) traders looking to bring precision and consistency into their technical analysis framework.

ZigZag ProZigZag Pro is a precise market structure indicator that automatically detects two independent ZigZag patterns and highlights breakouts whenever significant highs or lows are breached.
The indicator calculates two separate ZigZag structures in real time. ZigZag1 captures the broader market swings and is ideal for trend or swing trading. ZigZag2 is optional and reacts more quickly – perfect for intraday or scalping setups. Both layers are fully customizable in terms of depth, color, and line width.
What makes this tool especially useful: whenever a previous swing high (for long trades) or swing low (for short trades) is broken, the indicator draws a horizontal breakout line on the chart. This makes it easy to spot structural breakouts and take advantage of potential momentum moves.
ZigZag Pro is designed for traders who rely on clean, rule-based market structure — whether you're trading classic breakouts, smart money concepts, or simply want a clearer view of trend shifts. The visuals are minimal, responsive, and suitable for any timeframe.

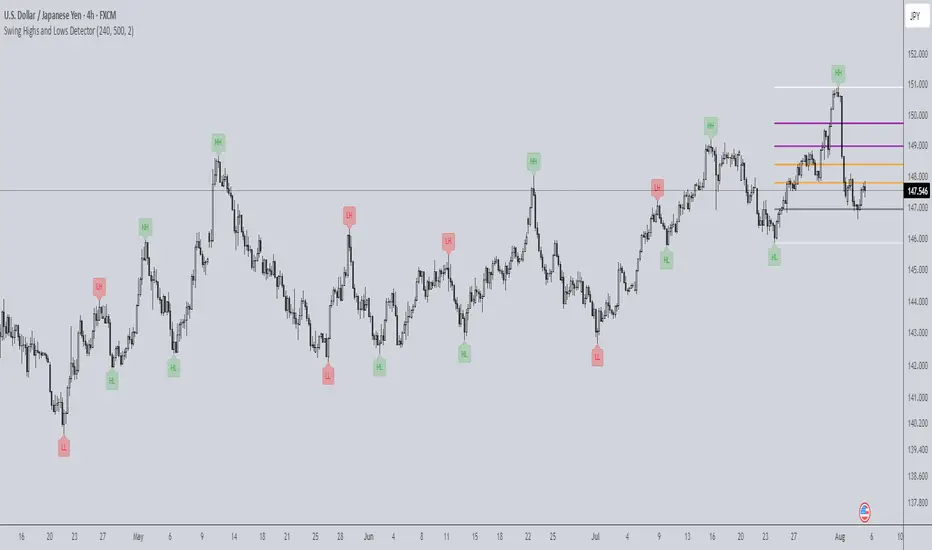
Swing Highs and Lows Detector🔍 Swing Highs and Lows Detector
The Swing Highs and Lows Detector is a powerful tool for traders looking to identify meaningful structural shifts in price action, based on swing point logic and internal trend shifts.
📈 What It Does
This indicator automatically identifies and labels:
HH (Higher High) – Price broke above the previous swing high
LH (Lower High) – Price failed to break the previous high, signaling potential weakness
LL (Lower Low) – Price broke below the previous swing low
HL (Higher Low) – Price maintained a higher support level, indicating strength
The script distinguishes between bullish and bearish internal shifts and tracks the highest/lowest points between those shifts to determine the swing structure.
⚙️ How It Works
You can choose between two shift detection modes:
"Open": Compares closing price to the first open of the opposite streak
"High/Low": Uses the high of bearish or low of bullish candles
Once a shift is confirmed, the indicator scans the bars between shifts to find the most significant swing high or low
When a valid swing is detected, it’s labeled directly on the chart with color-coded markers
🛎️ Built-in Alerts
Set alerts for:
Higher High
Lower High
Lower Low
Higher Low
These alerts help you catch key structural shifts in real time — great for breakout traders, structure-based analysts, and smart money concepts (SMC) strategies.
✅ How to Use
Confirm Trend Strength or Reversals – Use HH/HL to confirm an uptrend, LL/LH to confirm a downtrend
Combine with Liquidity Sweeps or Zones – Ideal for SMC or Wyckoff-style setups
Entry/Exit Triggers – Use swing breaks to time entries or exits near key structural points
HVC Daily LevelsDaily High Volume Candle Levels Marked on all Timeframes
HVC Level Sentinel v6 — High Volume Candle Levels
HVC Level Sentinel v6 automatically detects and highlights “High Volume Candles” (HVCs) — bars with the highest trading volume in a rolling, user-defined window (e.g., 30 days). This tool helps you spot key price levels where significant trading activity occurred, which can act as important support or resistance zones.
Features
Customizable Lookback: Choose how many bars to look back for HVC detection (default: 30 days, adjustable).
Automatic Highlighting: HVC candles are highlighted on your chart with a customizable color.
Level Lines: Draws horizontal lines at the Open, High, Low, and Close of each recent HVC, so you can easily track these key levels.
Line Fading: Only the most recent N HVCs (user-adjustable) have lines, with older lines fading out or disappearing for clarity.
Per-Line Control: Turn on/off Open, High, Low, and Close lines individually in the settings.
Fully Customizable: Adjust colors, line styles, widths, and opacity to fit your chart style.
How It Works
On each new bar, the script checks if the current bar’s volume is the highest in the last N bars.
If so, it marks the bar as an HVC and draws lines at its O/H/L/C (if enabled).
You can highlight all HVCs historically, but only the most recent N will have lines for a clean, focused chart.
Use Cases
Identify major breakout or reversal points driven by high volume.
Track where institutional or “smart money” activity may have occurred.
Use HVC levels as dynamic support/resistance for entries, exits, or stop placement.
Tip :
Adjust the lookback window and number of HVCs with lines to match your trading style—shorter for active trading, longer for swing/position trading.
Anchored VWAP by Time (Math by Thomas)📄 Description
This tool lets you plot an Anchored Volume Weighted Average Price (VWAP) starting from any specific date and time you choose. Unlike standard VWAPs that reset daily or weekly, this version gives you full control to track institutional pricing zones from precise anchor points—such as key swing highs/lows, market open, or news-driven candles.
It’s especially useful for price action and Smart Money Concepts (SMC) traders who track liquidity, fair value gaps (FVGs), and institutional zones.
🇮🇳 For NSE India Traders
You can anchor VWAP to Indian market open (e.g., 9:15 AM IST) or major events like RBI policy, earnings, or breakout candles.
The time input uses UTC by default, so for Indian Standard Time (IST), remember:
9:15 AM IST = 3:45 AM UTC
3:30 PM IST = 10:00 AM UTC
⚙️ How to Use
Add the indicator to your chart.
Open the settings panel.
Under “Anchor Start Time”, choose the date & time to begin the VWAP.
Use UTC format (adjust from IST if needed).
Customize the line color and thickness to suit your chart style.
The VWAP will begin plotting from that time forward.
🔎 Best Use Cases
Track VWAP from intraday range breakouts
Anchor from swing highs/lows to identify mean reversion zones
Combine with your FVGs, Order Blocks, or CHoCHs
Monitor VWAP reactions during key macro events or expiry days
🔧 Clean Design
No labels are used, keeping your chart clean.
Works on all timeframes (1min to Daily).
Designed for serious intraday & positional traders.

SMC ICT – Simplified Daily Trend & Reversal AnalyzerThis Pine Script provides a simplified approach to analyzing daily trends and potential reversals using concepts inspired by Smart Money Concepts (SMC) and ICT (Inner Circle Trader).
What It Does:
• Detects daily uptrend and downtrend conditions by comparing the current daily high/low to the previous day’s values.
• Highlights potential bullish or bearish reversal zones when price behavior suggests a shift in sentiment.
• Automatically draws dashed lines for the previous day's high and low.
• Labels these high/low levels for quick visual reference.
How to Use:
Apply this indicator to any timeframe chart. Use the plotted trend markers to assess daily direction and potential reversal signals. The dashed lines (previous high/low) can be used as reference points for liquidity zones or break/retest entries.
User Interface:
The indicator displays labels and shapes in English. This script is intended for educational and trading workflow enhancement purposes.
Note:
This is an open-source tool designed for clarity and basic SMC/ICT application. It is best used in combination with other confluences like FVGs, order blocks, and liquidity sweeps.

Support and Resistance Power Channel [ChartPrime]The Support and Resistance Power Channel indicator helps traders visualize key support and resistance zones, along with buy and sell power within those zones. By identifying the highest and lowest prices within a defined range, this indicator provides insight into potential price reversals and market strength. It calculates the strength of buy and sell pressure within the zones and includes additional features like midline values and delayed signals to reduce false breakouts.
⯁ KEY FEATURES AND HOW TO USE
⯌ Support and Resistance Zones :
This indicator identifies dynamic support (lower zone) and resistance (upper zone) levels, allowing traders to easily visualize key price levels. These zones are customizable with settings for the length of the channel and how far the zones extend into the future. The zones can be used to predict areas of potential price reversal or consolidation.
⯌ Buy and Sell Power :
Within the upper resistance zone, the indicator calculates Sell Power based on the number of bearish candles, while the lower support zone calculates Buy Power based on bullish candles. This feature helps traders understand the strength of buying or selling activity within each zone.
Example of buy and sell power tracking:
⯌ Highest, Lowest, and Mid Price Levels :
The indicator marks the highest and lowest price levels within the channel with an "X," and displays these values at the end of the channel. Additionally, the midline (average of the high and low) is plotted with a dotted line, showing a key area that the price often retests during trends.
⯌ Delayed Signal Markers :
To prevent false breakouts, the indicator includes a 2-bar delay for signals. These signals are plotted when the price crosses above or below the resistance or support zones, confirming potential reversals or breakouts. Arrows or diamonds are used to mark these signals on the chart.
Example of delayed breakout signals on the chart:
⯌ Extend Zones into the Future :
In the settings, traders can extend the support and resistance zones further into the future, allowing for ongoing analysis even after the initial levels have been identified. This feature can help with forward-looking trade planning.
⯁ USER INPUTS
Length : Defines the number of bars used to calculate the support and resistance zones.
Extend : Sets how far the support and resistance zones should be extended into the future.
Top and Bottom Colors : Allows customization of the colors for the support and resistance zones.
⯁ CONCLUSION
The Support and Resistance Power Channel indicator provides a powerful and visually intuitive way to track key market levels, buy and sell pressure, and potential reversals. With its real-time zone plotting and the calculation of power within each zone, it offers traders essential insights for making more informed trading decisions.

The ICT Ultimate Grid | MarketMaverisk GroupThe ICT Ultimate Grid | MarketMaverisk Group
This script is a fully customizable checklist based on ICT (Inner Circle Trader) concepts. It helps traders validate entry conditions across three timeframes:
LTP (Long-Term), ITP (Intermediate-Term), and STP (Short-Term).
⸻
✅ Purpose & Utility:
Instead of generating simple buy/sell signals, this tool assists traders in making structured, confirmation-based decisions. It presents a visual checklist with 11 customizable columns—each can be individually toggled for each timeframe and displays ✅ or ❌ confirmation status.
⸻
🧠 Confirmation Structure:
The checklist covers the following core elements from the ICT methodology:
• ERL⇔IRL and IRL⇔ERL (presented as special confirmations below the table)
• DOL – Drow On liqudity Level
• PD – permium or discuant
• SMT – Smart Money Trap / Inter-market Divergence
• CSD – Change in State of dlivery
• MSS – Market Structure Shift
• MMXM – Market maker (buy or sell) model
• FVG – Fair Value Gap
• OB – Order Block
• BRK.B – breker Block
Each item can be enabled or disabled for LTP, ITP, and STP individually.
⸻
📊 Visual Design:
• Clean, compact table displayed in the top-right corner of the chart.
• Clear color scheme (✅ Green = Confirmed, ❌ Red = Not Confirmed, Grey = Hidden/Disabled).
• Timeframes are stacked row-wise (LTP, ITP, STP).
• Inputs allow fine-grained control over what elements are shown in each timeframe.
• Additional rows are used to confirm:
• HTF Key Level
• Direction: Reversal ↩️ or Continuation 🔂
• Bias: Bullish 🔼 or Bearish 🔽
⸻
📈 Use Case:
This tool is ideal for traders who follow:
• ICT-based trading approaches
• Market structure + Liquidity analysis
• Day trading, scalping, or swing setups
• Confirmation-based entries after higher-timeframe alignment
⸻
⚙️ Recommended Timeframe Settings:
• LTP = D1 or 4H
• ITP = 1H or 15min
• STP = 5min or 3min or 1min
• Session time: Best used between 02:00 and 05:00 on london killzone & 08:00 and 12:00 on New york killzone in New York timezone (UTC -5)
(you can customize this in strategy version)
⸻
🛠 Technical Note:
This version is an indicator and does not generate signals or alerts by itself. For full automation, a strategy version is also available upon request.
⸻
Let me know if you’d like me to also write a “strategy description” or help you prepare the public chart layout 📊 to make your publish clean and attractivE

[TehThomas] - Fair Value GapsThis script is designed to automatically detect and visualize Fair Value Gaps (FVGs) on your chart in a clean, intuitive, and highly responsive way. It’s built with active traders in mind, offering both dynamic updates and customization options that help you stay focused on price action without being distracted by outdated or irrelevant information.
What Are Fair Value Gaps?
Fair Value Gaps are areas on a chart where there’s an inefficiency in price, typically formed when price moves aggressively in one direction, leaving a gap between the wicks of consecutive candles. These gaps represent imbalanced price action where not all buy or sell orders were efficiently matched. As a result, they often become magnet zones where price returns later to "fill" the imbalance before continuing in its intended direction. Many traders use them as points of interest for entries, re-entries, or anticipating reversals and consolidations.
This concept is frequently used in Smart Money and ICT-based trading models, where understanding how price seeks efficiency is crucial to anticipating future moves. When combined with concepts like liquidity, displacement, and market structure, FVGs become powerful tools for technical decision-making.
Script Features & Functionality
1. Live Updating Gaps (Dynamic Shrinking)
One of the core features of this script is its ability to track and dynamically shrink Fair Value Gaps as price trades into them. Instead of leaving a static zone on your chart, the gap will adjust in real-time, reflecting the portion that has been filled. This gives you a much more accurate picture of remaining imbalance and avoids misleading zones.
2. Automatic Cleanup After Fill
Once price fully fills an FVG, the script automatically removes it from the chart. This helps keep your workspace clean and focused only on relevant price zones. There’s no need to manually manage your gaps, everything is handled behind the scenes to reduce clutter and distraction.
3. Static Mode Option
While dynamic updating is the default, some traders may prefer to keep the original size of the gap visible even after partial fills. For that reason, the script includes a toggle to switch from live-updating (shrinking) mode to static mode. In static mode, FVGs stay fixed from the moment they are drawn, giving you a more traditional visual reference point.
4. Multi-Timeframe Support (MTF)
You can now view higher timeframe FVGs, such as those from the 1H or 4H chart, while analyzing lower timeframes like the 5-minute. This allows you to see key imbalances from broader market context without having to flip between charts. FVGs from higher timeframes will be drawn distinctly so you can differentiate them at a glance.
5. Cleaner Visualization
The script is designed with clarity in mind. All drawings are streamlined, and filled gaps are removed to maintain a minimal, distraction-free chart. This makes it easier to combine this tool with other indicators or price-action-based strategies without overloading your workspace.
6. Suitable for All Market Types
This script can be used on any asset that displays candlestick-based price action — including crypto, forex, indices, and stocks. Whether you're scalping low-timeframe setups or swing trading with a higher timeframe bias, FVGs remain a useful concept and this script adapts to your trading style.
Use Case Examples
On a 5-minute chart, display 1-hour FVGs to catch major imbalance zones during intraday trading.
Combine the FVGs with liquidity levels and inducement patterns to build ICT-style trade setups.
Use live-updating gaps to monitor in-progress fills and evaluate whether a zone still holds validity.
Set the script to static mode to perform backtesting or visual replay with historical setups.
Final Notes
Fair Value Gaps are not a standalone trading signal, but when used with market structure, liquidity, displacement, and order flow concepts, they provide high-probability trade locations that align with institutional-style trading models. This script simplifies the visualization of those zones so you can react faster, stay focused on clean setups, and eliminate unnecessary distractions.
Whether you’re trading high volatility breakouts or patiently waiting for retracements into unfilled imbalances, this tool is designed to support your edge with precision and flexibility.

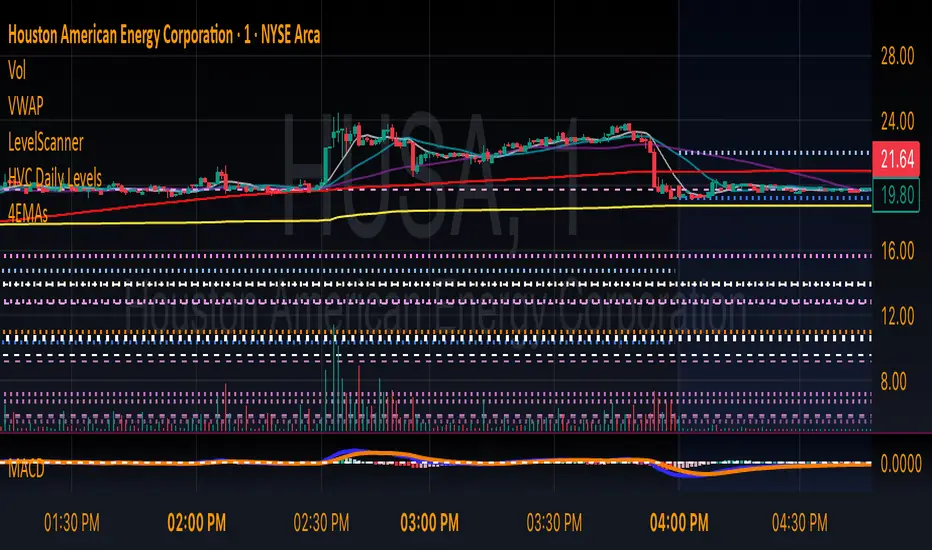
Enhanced Volume w/ Pocket Pivots, Milestones & LiquiditySure! Here’s a professional and clear **description** you can use when saving or publishing the script on TradingView:
---
## 📄 Script Description: *Enhanced Volume w/ Pocket Pivots, Milestones & Liquidity*
This custom volume indicator enhances the default volume view by combining key institutional-level insights into a single tool. It highlights meaningful volume activity, liquidity conditions, and milestone events to help traders better understand accumulation/distribution and smart money participation.
### 🔍 Features:
* **Color-coded volume bars**:
* 🔵 **Pocket Pivot Volume (PPV)**: Up-day with volume > highest down-day volume of last 10 bars.
* 🟢 **Up Volume**: Up-day with volume > 50-day average.
* 🔴 **Down Volume**: Down-day with volume > 50-day average.
* 🟠 **Dry Volume**: Low-volume bars < 20% of 50-day average.
* ⚫ **Neutral/Other bars**: No significant signal.
* **Volume Milestones**:
* **HVE**: Highest volume ever (20 years lookback).
* **HVY**: Highest volume in the past 1 year (252 bars).
* **HVQ**: Highest volume in the past quarter (63 bars).
* **Projected Volume**:
* Real-time estimate of end-of-day volume based on elapsed session time.
* **Liquidity Metrics**:
* Displays current and 50-day average dollar volume.
* Estimates 1-minute liquidity for large-position feasibility.
* **Relative Volume Label**:
* Displays how today’s volume compares to the 50-day average.
* **Alerts Included**:
* Set alerts for HVE, HVY, and HVQ to catch key breakout or climactic volume events.
---
### 🧠 Ideal For:
* Growth stock traders
* Volume/price analysts
* Intraday & swing traders
* Institutions or prop traders needing liquidity benchmarks
---
Let me know if you'd like a short or promotional version (for sharing with others).

Market Structure- ZigZag, Break of Structure & Order BlocksDescription:
This script is an all-in-one market structure tool designed for traders who follow price action, Smart Money Concepts (SMC), or institutional order flow. It combines Order Block detection , Break of Structure (BOS) , Internal Structure Shifts (CHoCH) , and a ZigZag swing framework to provide a clear and actionable view of market behavior.
Key Features:
Order Blocks (OB) :
-Detects Bullish (Green) and Bearish (Red) order blocks upon valid market structure shifts.
-Optional deletion of mitigated (touched) blocks to keep charts clean.
-Customizable block duration, fill color, and border color.
Break of Structure (BOS) :
-Marks BOS with horizontal dotted lines when price breaks previous swing highs/lows.
-Confirms new trends and structural shifts.
Internal Structure Shifts (CHoCH-like) :
-Detects early internal changes in direction before BOS.
-User-selectable logic: based on candle Open or High/Low.
-Plotted as small black triangle markers.
ZigZag Swings :
-Connects confirmed internal shifts with black zigzag lines.
-Visually simplifies trend structure and major swing points.
-Tracks last swing highs/lows for BOS validation.
Alerts :
-Bullish/Bearish Engulfments (OB signals)
-Internal Structure Shifts
-Bullish/Bearish Break of Structure
-OB Mitigation Events
Inputs & Settings :
-Show/Hide Bullish or Bearish Order Blocks
-Calculate internal shifts by: Open or High/Low
-Set order block fill and border colors
-Enable or disable automatic deletion of mitigated blocks
-Set duration for order block display
This tool is designed to support price action trading by visually mapping key structural changes and zones of interest directly on your chart. It is not intended to function as a standalone trading strategy , but rather as a supplementary tool to inform your own analysis and discretion.

Order Block with BoSHere’s a professional and concise description you can use for publishing your **TradingView script** titled **"Order Block with BoS"**:
---
### 📌 **Description for TradingView Publication:**
**"Order Block with Break of Structure (BoS)"** is a powerful price action-based indicator designed to identify potential reversal zones and momentum shifts using **Order Block** detection combined with **Break of Structure (BoS)** confirmation.
### 🔍 **Key Features:**
* **Order Block Detection**: Highlights bullish and bearish order blocks using precise candle structure logic.
* **Break of Structure (BoS)**: Confirms structural breaks above swing highs or below swing lows to validate potential trend continuation or reversal.
* **Dynamic ATR Filter**: Uses a 14-period ATR with dynamic thresholds to confirm significant moves, filtering out weak breakouts.
* **Visual Aids**:
* Color-coded **boxes** to mark detected Order Blocks.
* **Arrows** at BoS confirmation points when ATR confirms strong momentum.
* Optional **dashed BoS lines** to show where price broke structure.
### ⚙️ **Customizable Inputs**:
* `Swing Length`: Defines the sensitivity of swing high/low detection.
* `Show Break of Structure`: Toggle on/off BoS confirmation lines.
* `Candle Lookback`: Number of historical candles to consider.
This indicator is ideal for traders who incorporate **smart money concepts**, **market structure analysis**, or **institutional order flow** strategies.
---
Would you like me to help write the **strategy** version of this or translate the description into another language for international audiences?

Apex Edge – Super RSIThe Apex Edge – Super RSI is not your average RSI. This is an institutional-grade signal engine designed for serious traders who want confluence, control, and confidence — all wrapped into one visual powerhouse.
━━━━━━━━━━━━━━━━━━━━
KEY FEATURES
━━━━━━━━━━━━━━━━━━━━
✔ **RSI + Divergence Engine**
• Classic & Hidden Divergences (auto-detected)
• Labelled with shapes:
▲ Green Triangle – Buy Signal (strength-based size)
▼ Red Triangle – Sell Signal
◆ Green Diamond – Classic Bullish Divergence
◆ Red Diamond – Classic Bearish Divergence
● Green Circle – Hidden Bullish Divergence
● Red Circle – Hidden Bearish Divergence
Note - Users can edit symbol colours in settings for better clarity
✔ **Trap Detection System**
• Detects low-move, high-signal clusters (liquidity traps)
• Automatically suppresses signals for X bars after detection
• Trap zones shown with shaded background (optional)
✔ **Signal Scoring Logic**
• Each signal is scored 1–6 based on:
• RSI Threshold Break
• RSI Slope
• Divergence Detected
• Trap Avoidance
• Multi-Timeframe Confluence (optional)
• The plotted shape size reflects the strength of the entry signal
✔ **Multi-Timeframe Confluence (MTF)**
• Optional filter that uses HTF and VHTF RSI alignment
• Prevents countertrend signals
• MTF Bias shown on HUD panel
✔ **Always-On HUD Panel**
• Displays:
• Signal Type
• Signal Score
• Divergence Type
• RSI (LTF & HTF)
• Trap & Cooldown Status
• MTF Bias
• Volatility %
✔ **Alert Ready**
• Buy/Sell alerts
• Trap Detected alert
• Divergence alert with dynamic message
• Perfect for webhook integrations
━━━━━━━━━━━━━━━━━━━━
📘 HOW TO TRADE IT
━━━━━━━━━━━━━━━━━━━━
✅ **Buy Setup**
• Green triangle (▲) appears **below bar**
• RSI is oversold and rising
• HTF RSI agrees (optional)
• Signal score is 3+ for best confidence
• Avoid signals during cooldown zone
✅ **Sell Setup**
• Red triangle (▼) appears **above bar**
• RSI is overbought and falling
• HTF RSI agrees (optional)
• Signal score is 3+ for best confidence
✅ **Divergences**
• Use diamonds/circles to identify momentum shifts
• Strongest when aligned with score 4–6
❗**Trap Zones**
• When background is shaded, wait for cooldown
• Signals during traps are suppressed for safety
━━━━━━━━━━━━━━━━━━━━
📊 BEST USED WITH
━━━━━━━━━━━━━━━━━━━━
🔹 Apex Edge – Session Sweep Pro (to visualize liquidity levels)
🔹 Volume Profile or OBV (volume-based confirmation)
🔹 EMA Ribbon (for trend alignment)
🔹 Fair Value Gap indicator (smart money models)
━━━━━━━━━━━━━━━━━━━━
🧠 PRO TIPS
━━━━━━━━━━━━━━━━━━━━
• Use the HUD for decision confidence — if everything aligns, you’ve got an Apex-grade setup.
• Wait for candle close to confirm divergence-based entries.
• Score 5–6 = sniper entries. Score 1–2 = warning shots.
This indicator can be used alongside Apex Edge Session Sweep Pro for better visual clarity.
━━━━━━━━━━━━━━━━━━━━
© Apex Edge | All rights reserved.
3 days ago
Release Notes
Update - Added a toggle to show/hide HUD when using on smaller mobile devices so as not to clutter the screen.

Intraday Pivot Highs & Lows (Asia London NY)Intraday Pivot Highs & Lows (Asia London NY)
Script Description
This TradingView indicator is optimized for Forex, scalping, intraday, and day trading strategies. It accurately plots Pivot Points and levels, high/low, support and resistance levels. These are clearly identified to aid the trader during killzone sessions and session opens. Ideal for scalp trading, intraday sessions, and leveraging SMT (Smart Money Techniques). Utilize these Price Levels effectively during London Open, NY Open, and the Asia Session, utilizing Market Structure to pinpoint key levels and reversal zones for successful trading. Improve your Trade Setups, recognize reliable Chart Patterns, identify critical Price Pivots, and trade confidently off Institutional Levels.
This script marks the intraday pivot highs, lows and midpoints retracement levels for
Asia
London
New York
It also plots the previous day's high, low, midpoint, and 0.618 Fibonacci retracement levels, providing traders with critical price reference points for making intraday trading decisions.
Originality & Usefulness
This indicator uniquely integrates pivot calculations across three major Forex sessions (Asia, London, NY), clearly delineating session boundaries.
It enhances visibility by using distinct styling
solid for New York
dashed for London
dotted lines for Asia
And colour co-ordinated labeling, improving traders' ability to identify important intraday price action zones efficiently. Unlike standard pivot indicators, this script emphasizes session-specific trading dynamics.
### Key Features ###
Session-Based Levels: Automatically plots high, low, midpoint, and Fibonacci (.618) levels for each major session (Asia, London, NY).
Distinct Visual Cues: Lines and labels use session-specific styles and colors to easily differentiate between sessions.
Previous Day Reference: Clearly plots and labels yesterday's high, low, midpoint, and Fibonacci levels.
Flexible Visibility: Traders can set timeframe visibility to maintain clean charts on higher timeframes.
### How It Works
At the start of next day's session, previous session lines are cleared, ensuring the chart remains uncluttered.
High, low, midpoint, and Fibonacci retracement levels (.618) are dynamically calculated and displayed at the close of each session.
All session levels remain visible until the start of the next respective session, providing continuous actionable insights.
Trading Application:
Session highs and lows act as strong intraday support and resistance zones.
Midpoints and Fibonacci levels are effective for identifying potential reversal zones and retracements.
Daily levels provide a broader context, useful for gauging intraday volatility and range.
### Limitations and Considerations ##
Best used on liquid assets with clear session-based price action, such as Forex major pairs, if used on indexes make sure they contain 24 hour price action not just New York session.
This indicator is designed to streamline intraday trading by clearly marking essential pivot points and session-based levels, significantly improving traders' market context and decision-making accuracy. Can be used to enhance SMT decision making when scalping killzones.

Multitimeframe Order Block Finder (Zeiierman)█ Overview
The Multitimeframe Order Block Finder (Zeiierman) is a powerful tool designed to identify potential institutional zones of interest — Order Blocks — across any timeframe, regardless of what chart you're viewing.
Order Blocks are critical supply and demand zones formed by the last opposing candle before an impulsive move. These areas often act as magnets for price and serve as smart-money footprints — ideal for anticipating reversals, retests, or breakouts.
This indicator not only detects such zones in real-time, but also visualizes their mitigation, bull/bear volume pressure, and a smoothed directional trendline based on Order Block behavior.
█ How It Works
The script fetches OHLCV data from your chosen timeframe using request.security() and processes it using strict pattern logic and volume-derived strength conditions. It detects Order Blocks only when the structure aligns with dominant pressure and visually extends valid zones forward for as long as they remain unmitigated.
⚪ Bull/Bear Volume Power Visualization
Each OB includes proportional bars representing estimated buy/sell effort:
Buy Power: % of volume attributed to buyers
Sell Power: % of volume attributed to sellers
This adds a visual, intuitive layer of intent — showing who controlled the price before the OB formed.
⚪ Order Block Trendline (Butterworth Filtered)
A smoothed trendline is derived from the average OB value over time using a two-pole Butterworth low-pass filter. This helps you understand the broader directional pressure:
Trendline up → favor bullish OBs
Trendline down → favor bearish OBs
█ How to Use
⚪ Trade From Order Blocks Like Institutions
Use this tool to find institutional footprints and reaction zones:
Enter at unmitigated OBs
⚪ Volume Power
Volume Pressure Bars inside each OB help you:
Confirm strong buyer/seller dominance
Detect possible traps or exhaustion
Understand how each zone formed
⚪ Find Trend & Pullbacks
The trendline not only helps traders detect the current trend direction, but the built-in trend coloring also highlights potential pullback areas within these trends.
█ Settings
Timeframe – Selects which timeframe to scan for Order Blocks.
Lookback Period – Defines how many bars back are used to detect bullish or bearish momentum shifts.
Sensitivity – When enabled, the indicator uses smoothed price (RMA) with rising/falling logic instead of raw candle closes. This allows more flexible detection of trend shifts and results in more Order Blocks being identified.
Minimum Percent Move – Filters out weak moves. Higher = only strong price shifts.
Mitigated on Mid – OB is removed when price touches its midpoint.
Show OB Table – Displays a panel listing all active (unmitigated) Order Blocks.
Extend Boxes – Controls how far OB boxes stretch into the future.
Show OB Trend – Toggles the trendline derived from Order Block strength.
Passband Ripple (dB) – Controls trendline reactivity. Higher = more sensitive.
Cutoff Frequency – Controls smoothness of trendline (0–0.5). Lower = smoother.
-----------------
Disclaimer
The content provided in my scripts, indicators, ideas, algorithms, and systems is for educational and informational purposes only. It does not constitute financial advice, investment recommendations, or a solicitation to buy or sell any financial instruments. I will not accept liability for any loss or damage, including without limitation any loss of profit, which may arise directly or indirectly from the use of or reliance on such information.
All investments involve risk, and the past performance of a security, industry, sector, market, financial product, trading strategy, backtest, or individual's trading does not guarantee future results or returns. Investors are fully responsible for any investment decisions they make. Such decisions should be based solely on an evaluation of their financial circumstances, investment objectives, risk tolerance, and liquidity needs.

Liquidity Sweep Detector - PDH/PDL LevelsPrevious Day High/Low Liquidity Sweep Detector (Intraday Accurate)
This indicator tracks the previous day's high and low using intraday data, rather than the daily candle, ensuring precise sweep detection across lower timeframes (15m to 4H).
It monitors for liquidity sweeps—moments when price briefly moves above the previous high or below the previous low—and visually marks these events on the chart.
Key Features
Intraday-accurate PDH/PDL tracking
Real-time sweep detection
On-chart labels marking sweep events
Toggleable table showing sweep status
Alert conditions for PDH/PDL sweep triggers
Best For
Traders who use Smart Money Concepts (SMC), liquidity-based strategies, or look for stop hunts and reversal zones tied to key prior-day levels.
Works well across FX, crypto, and indices on 15m, 1H, and 4H charts.
